MacroSonar
BETA — FREE

Understand the regime.
Position with confidence.

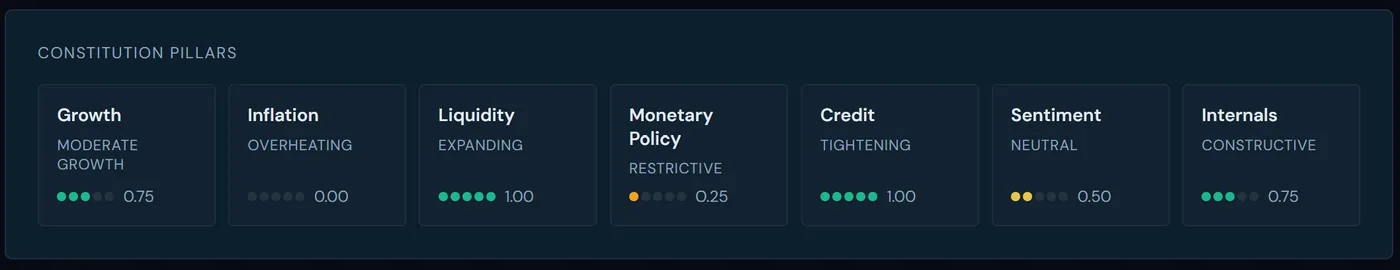
One clear market regime built from macro, liquidity, policy, credit, sentiment, and market internals.

MacroSonar Master Regime — Fragile Bull verdict with confidence, internal-stress, credit, and the 7-pillar read

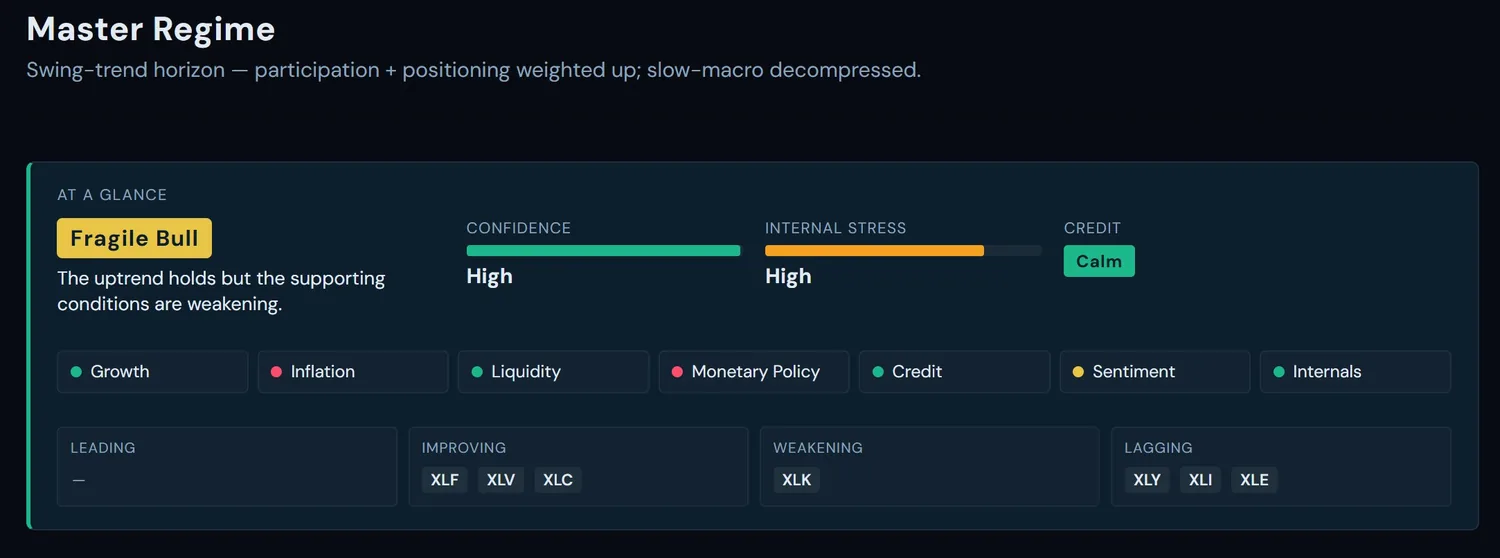
Sample Master Regime data — the live page at /dashboard shows today's actual At-a-Glance verdict, confidence, internal-stress, and 7-pillar read.

The data is public. The synthesis isn't.

Most platforms show data. MacroSonar explains what it means.

HOW MACROSONAR THINKS

Seven components. One regime read.

Each component is scored on its own band ladder, then synthesized into a single market-regime verdict — not seven separate calls, one read.

Growth MODERATE GROWTH
Inflation OVERHEATING
Liquidity EXPANDING
Monetary Policy RESTRICTIVE
Credit / Financial Stress STABLE
Sentiment NEUTRAL
Internals CONSTRUCTIVE
REGIME ENGINE
Scores each component on its own band ladder and synthesizes all seven into one verdict — the synthesis raw data feeds don't give you.
FRAGILE BULL

What to watch: the bull core — Growth, Liquidity, Credit — holds, but Inflation overheating and a restrictive Fed are the fragility flags. That tension is the “but” in Fragile Bull.

Sample regime-engine data — the live page at /dashboard shows today's actual seven-component read and verdict.

128 indicators · 13 categories · 500K+ observations · hourly + daily refreshes
SHOW YOUR WORK

The regime read, decomposed.

Seven scored regime components and the valuation context they sit in — the same numbers the verdict is built from.

MacroSonar Constitution Pillars — Growth, Inflation, Liquidity, Monetary Policy, Credit, Sentiment, and Internals, each with a directional rating and 0–1 score

Sample Constitution Pillars data — the live page at /dashboard shows today's actual 7-pillar component ratings and scores.

MacroSonar Valuation Context — Forward P/E 19.89x, Simple ERP 0.6%, Shiller CAPE 42.80x, and Buffett Indicator 184.1%, with CAUTION/DANGER/CRISIS bands

Sample Valuation read data — the live page at /indicators/valuation shows today's actual Forward P/E, ERP, Shiller CAPE, and Buffett-Indicator context with their stress bands.

SECTOR ROTATION

Where the money is rotating.

Relative Rotation Graph — the 11 sector ETFs plotted by relative strength and momentum across the four rotation quadrants, with multi-week tails.

Sector Relative Rotation Graph: 11 sector ETFs plotted by RS-Ratio and RS-Momentum across the Leading, Weakening, Lagging, and Improving quadrants, each with a multi-week tail.

Snapshot from the live page — open the interactive Sector RRG for today's rotation with selectable 1–26 week tails.

CYCLE POSITION

Where we sit in the Juglar cycle.

Today's SPY path indexed against historical Juglar (~9-year capex) cycle analogs from the trough — a read on cycle position, not a price target.

Juglar cycle overlay: current SPY path indexed (trough = 100) against 1982, 1990, 2002, and 2009 cycle analogs and the historical average, with a vertical TODAY marker.

Snapshot from the live page — open the interactive Juglar overlay for the current cycle vs historical analogs with the TODAY marker.

FOUR LAYERS · ONE PRODUCT

Built for analysts who want the work shown.

Indicators
128 across 13 categories — every one with a contrarian/directional classification and a published threshold band.
Frameworks
Three decision pipelines — investor, reactive swing, contrarian swing — each with backtest-validated thresholds at the point of decision.
Forecast
A single SPY path through the next macro cycle — Kitchin/Juglar/Kuznets calibrated, sequential not parallel.
Timeline
Today's macro state matched against six historical cycle templates — with honest variance scoring and exogenous-shock flagging.

See today's regime read for yourself.

Free Beta — the full dashboard, all three frameworks, every threshold shown.

Get Beta access — free
TIMELINE

Match today against
six historical cycles.

Pattern-recognition over six annotated cycle templates — 1998 LTCM, 2000 Dot-com, 2007 GFC, 2018 Powell, 2020 COVID, 2022 Rates. Nine validated signals, z-score normalized, Euclidean-distanced.

Variance classification is honest: STRONG, PARTIAL, or AMBIGUOUS match. COVID is flagged exogenous because pattern matching against shock cycles is structurally unreliable — surfaced, not buried.

TOP-3 HISTORICAL ANALOGS PARTIAL MATCH
1.42
2018 Powell Pivot
matched at month +14 · z-distance 1.42
1.91
2007 GFC pre-trough
matched at month -8 · z-distance 1.91
2.34
2020 COVID (exogenous shock — pattern requires similar trigger)
matched at month -3 · z-distance 2.34
9-signal Euclidean match · 6-cycle template library · 227 source citations

Sample analog match data — the live page at /timeline shows today's actual top-3 cycle analogs, variance classification, and z-distances.

INDICATORS

128 indicators.
Every one with a published threshold.

Macro · Liquidity · Credit · Rates · Breadth · Sector · Sentiment · Volatility · Valuation · Recession · Housing · Safe Haven · Structure. 13 categories, 590,884 historical observations, weekly + intraday refresh cadences depending on the source.

Every indicator detail page ships the full history chart, contrarian/directional classification, threshold band, and historical parallels at past S&P drawdowns. Sources are cited per-indicator. When a source is degraded — like AAII below — we surface NO_DATA rather than hide the row.

SENTIMENT · LIVE INDICATORS
NAAIM Active Mgr Exposure82.4CAUTION
Smart Money Confidence38CAUTION
Dumb Money Confidence71STRESS
AAII Bull-Bear Spread Source temporarily unavailable — Imperva block NO_DATA
Hover the dashed AAII row for the source-unavailable note.

Sample Sentiment indicators data — the live page at /indicators/sentiment shows today's actual live readings (AAII row stays NO_DATA — Imperva block on the source).

PRICING

One free tier today. Pro tiers when they're ready.

MacroSonar publishes research and analytics for self-directed traders. Nothing on this site is personalized investment advice, a recommendation to buy or sell any security, or a solicitation. Past performance and backtest results do not guarantee future results.

AVAILABLE NOW
Beta
FREE
Anyone who registers gets in.
  • Full dashboard — 128 indicators, 13 categories
  • All three frameworks (investor, swing, contrarian)
  • Macro forecast + cycle timeline
  • Per-indicator detail charts + history
  • Email when paid tiers open
Create free account
COMING SOON
Pro
Pricing TBD. Join the waitlist.
  • · Custom alerts on threshold crossings
  • · CSV/API export of indicator history
  • · Single-name regime context (the macro framework applied to individual tickers)
  • · Priority support